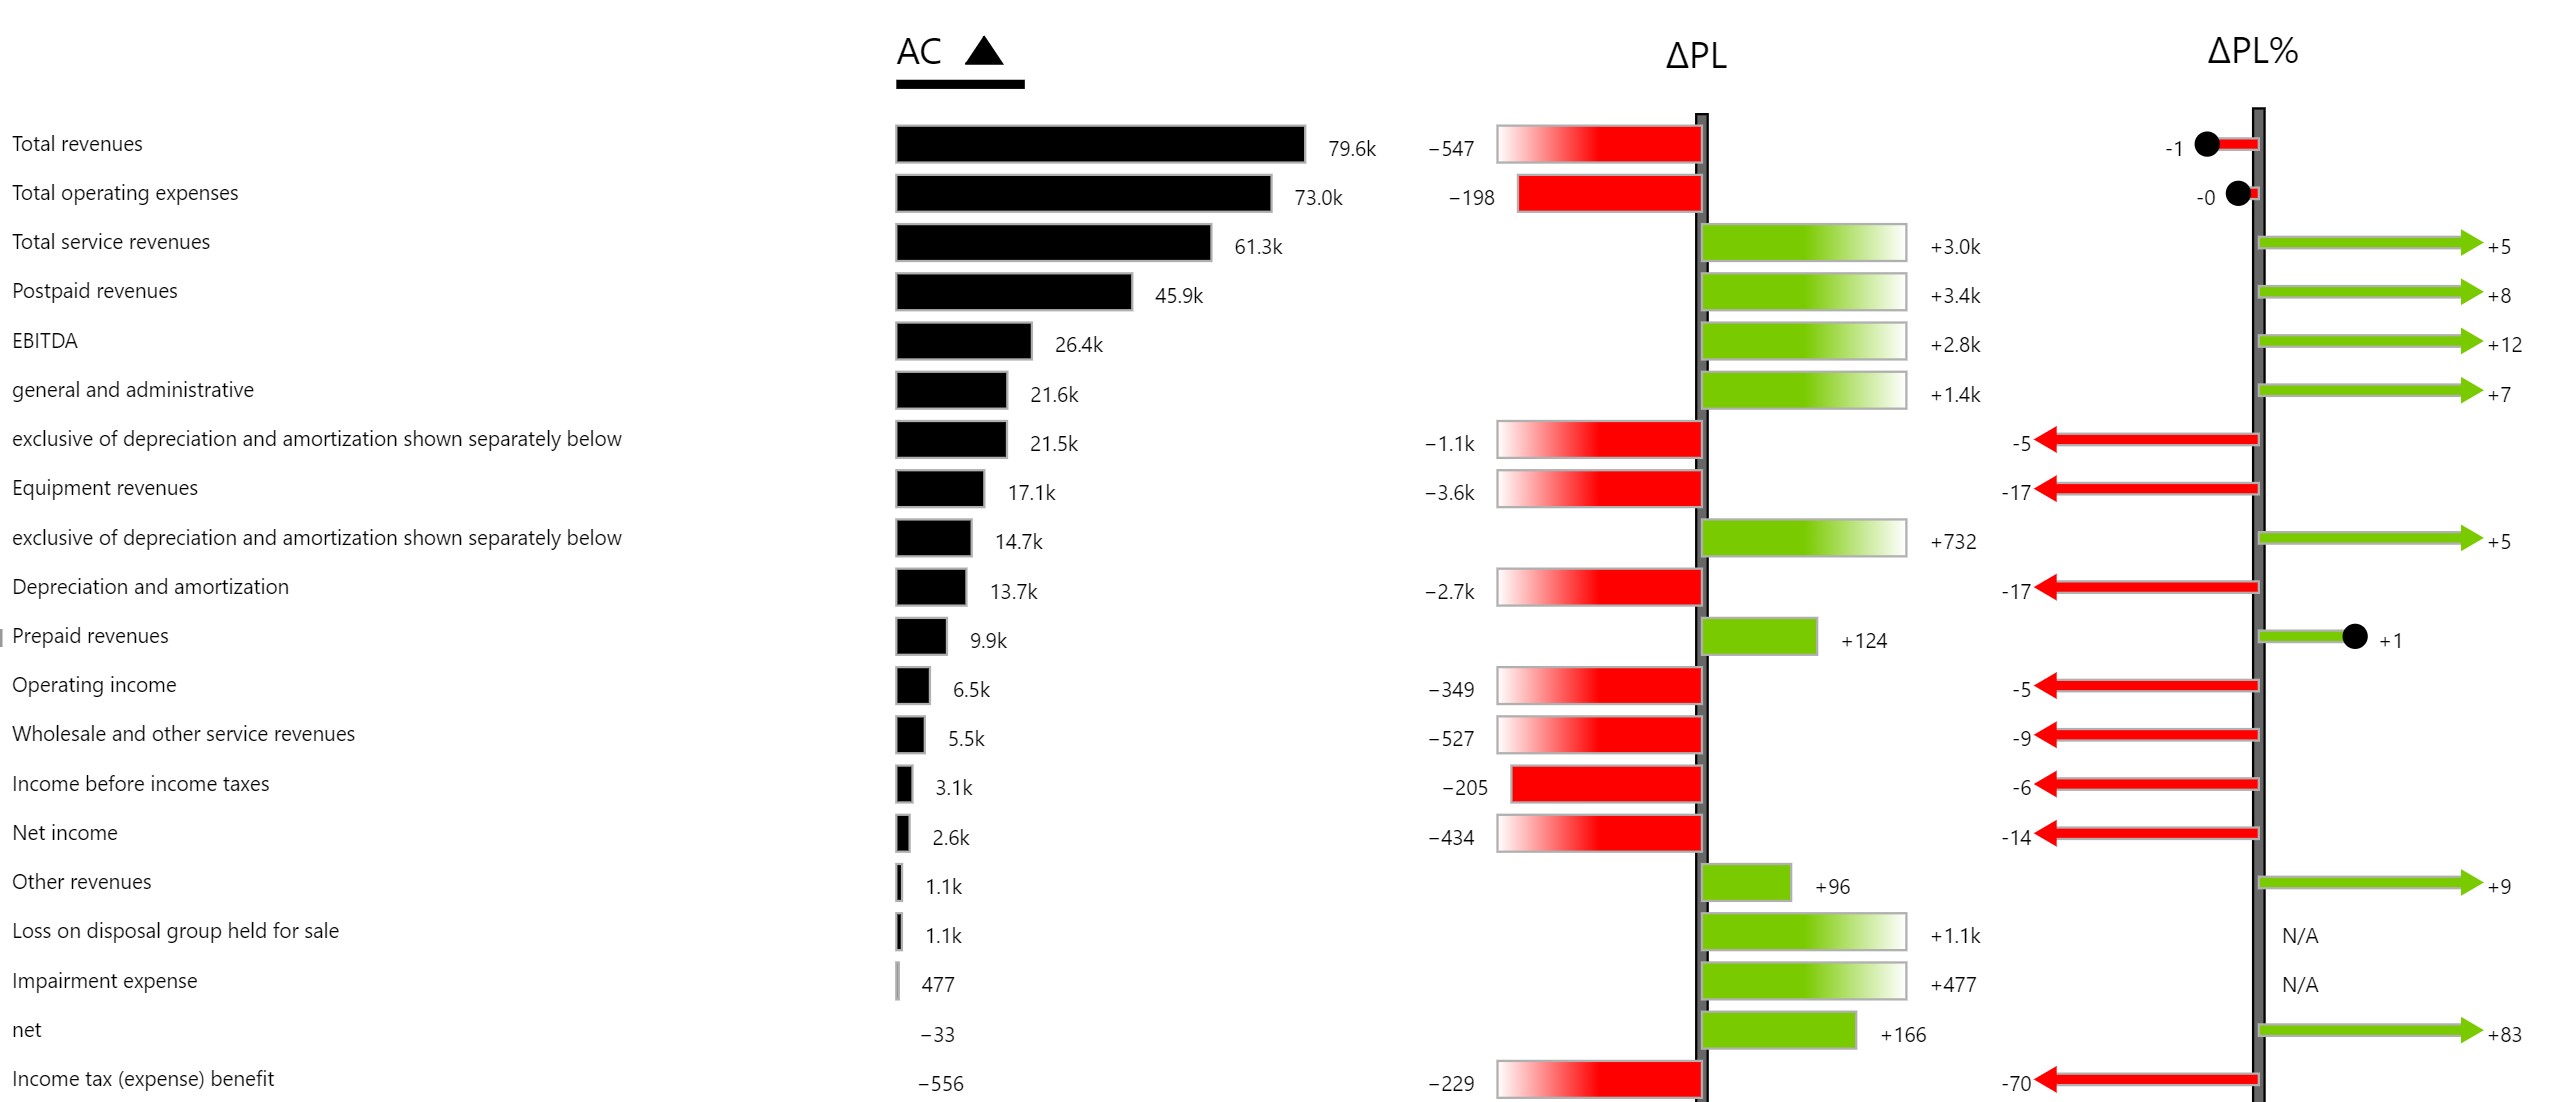
Wavatek waterfall allows multiple scenario comparisons to live on the same visualization. Whether you need Actual vs Budget, Actual vs Forecast or any other combination you can have them all on the same visualization and then access them using the navigational arrows.Having a broad range of formatting options you can design the visualization to fit any formatting criteria that you dashboard requires.
CHECK OUT
Wavatek Barchart
Wavatek barchart is a versatile visualizations that combines the functionality of barchart analysis with a line chart analysis. Both options can levrage scenario comparisons and these different modes are accessible using the navigational arrows of the graph. One remarkble feature of the visualization is the custom calculation mechanism where a user can select any two data point of the graph and the system will compute the absolute and the percentage difference between the two.
DISCOVER
Wavatek Tables
Wavatek Tables provide the opportunity to analyze two scenarios in a tabluar format. The users have the option to have multiple breakdown criterias by which the comparison is done. Absolute and percentage difference between the two scenarios will be provided by the graph.
Why choose Wavatek Visualizations
Impressive business performance view
Get instant insight on what’s happening in your business using the native scenario comparisons functionalities of Wavatek visualizations.
Calculations at your fingertip
Barchart visualizations offer the possibility to create custom calculations based on your data – Need to compare two years on your visualizations? No worries – you can do this with two clicks in Wavatek Barchart.
Plug & Play Visualizations
No need for technical skills. Wavatek visualizations offer an intuitive way to configure the graphs thus enabling the users to spend more time on analyzing the data.
Toggle between available graph mode
Each Wavatek visualizations offers multiple options of visualizing your data. What started as a barchart visualization can easily transform to linechart visualization by simply using the navigational arrows of the graph.
GET HELP (HELP CENTER)
Frequently asked questions.
What does the package include?
When you buy Wavatek visuals , you get all 3 visuals Waterfall, Barchart and Tables including any future update.
How does the 30-day trial work?
You will receive the 3 visuals with 1 month only license with full access to all functionalities
How do I pay for your service?
You can pay directly on our web site using credit card ( through Stripe) or you can contact us if you prefer to pay by bank transfer.
Can I suggest a new feature?
Yes all suggestion are very welcome, and will give special attentions to them.